Home
Home
-
Magic Box basicsMagic Box toolsStudent engagement
XY Graph
The XY Graph can be found in Magic Box's tools  menu and is available in the Windows version of myViewBoard Whiteboard only. Use the XY Graph to plot lines on the horizontal and vertical axes of digital graph paper.
This tool can be used on the canvas in Present and Prepare modes.
Add a graph to the canvas
- On the main toolbar, press
 .
. - In the Magic Box window, select
 .
. - Double press
 (or press and drag the icon onto the canvas).
 - The graph will appear on the canvas.
Actions available
Use the XY Graph to plot values on the x and y (horizontal and vertical) axes. The following options are available:
- Press and drag
 to move the XY Graph around the canvas.
 - Toggle between the following options:
-
 Create straight lines.
 -
 Draw freehand lines.
 -
.png) Erase lines (one press per line to erase).
Erase lines (one press per line to erase).
-
- Press
 to access a transparency slider.
 - Press
 to toggle the grid display.
 - Press
.png) to toggle between hiding/showing axis numbers.
to toggle between hiding/showing axis numbers. - Press
 to close the graph.
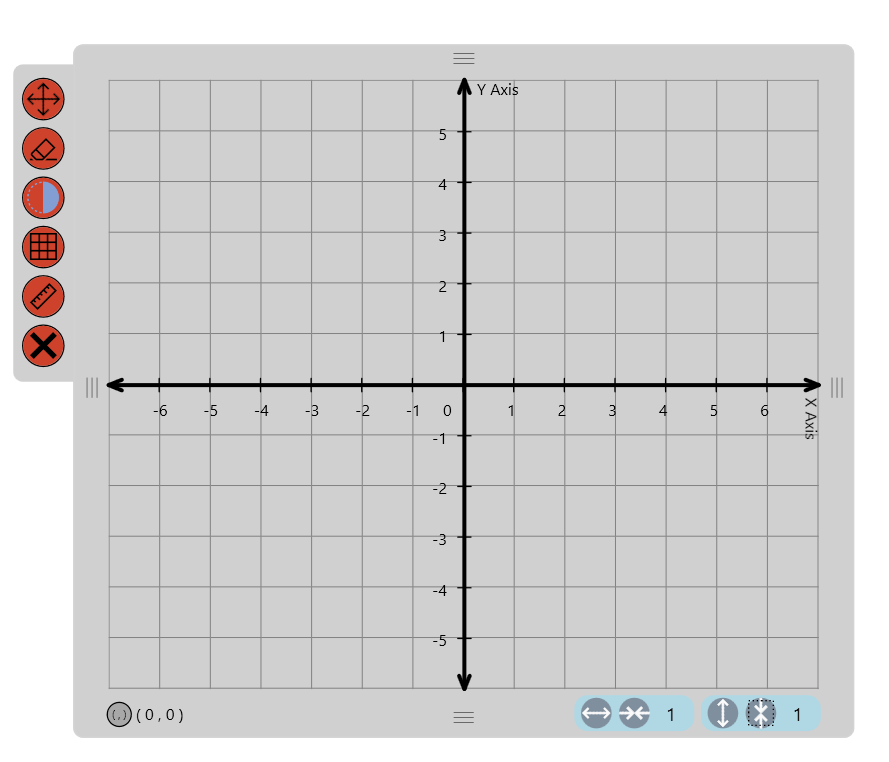 Preview of the graph on the canvas.
 User creates straight lines in different colors, and then freehand draws a line.
 User toggles graph grid lines, extends the graph's X-axis, and then changes the units of the x-axis and y-axis.